Capturing a trace with UIforETW
Event Tracing for Windows (ETW) is an incredibly useful tracing mechanism built into Windows, however, it’s not the easiest thing to use. In my day job, ETW is incredibly useful to get profiling samples from customer machines to get insights into performance issues. Since I keep writing the same How-To for everyone, I figured I just write down once here and then link it to people. If you are here because I sent you such a link, welcome!
Getting UIforETW
UIforETW is an incredibly useful GUI tool over ETW created by one of the Chromium developers at Google. It takes the pain of using ETW from the command line away and provides a simple and easy to use interface. Hence why the first step to getting a trace is to download UIforETW.
You can find UIforETW hosted here on Github, simply click the link etwpackageX.Y.zip where X and Y are the version number. At the time of writing, 1.49 is the latest version. After downloading, simply unpack the zip file.
Open the new etwpackage folder and go into the bin folder, where you’ll find a UIforETW.exe. This is the actual application and what you’ll need to run. Getting a trace
You should now see something like this:
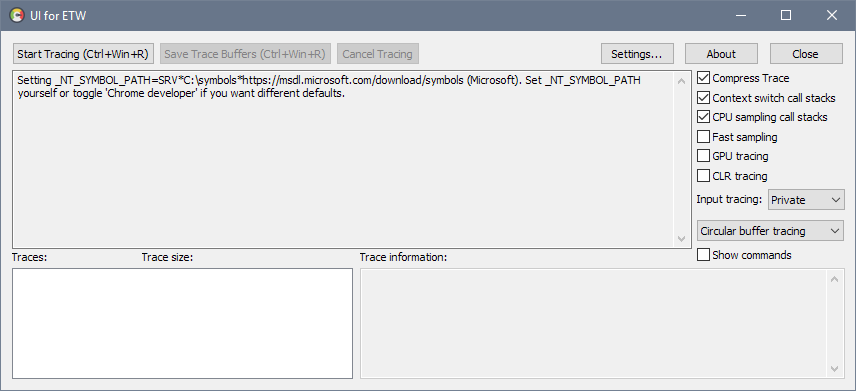
One of the nice things about ETW is that you can just keep it running in the background with near 0 perf hit while you try to recreate your FPS issues. I might ask you to change some of the settings on the right, so if I did, just do these changes now.
The second step now is to click on “Start Tracing”. The following message should show up in the message field:
Starting tracing to in-memory circular buffers… Tracing is started.
Now, all you need to do is to go where the FPS is bad or recreate the performance issue. If it’s a long lasting event, try to maintain it for a good 20-30 seconds or so, so that there is a good sample captured.
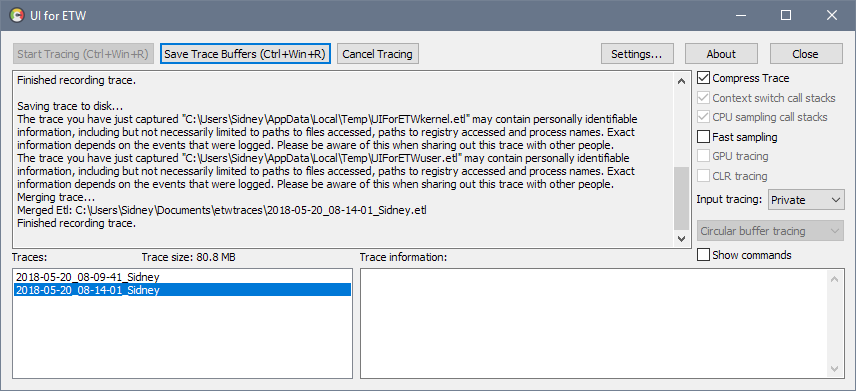
Once you have recorded enough of the performance issue, you can click “Save Trace Buffers” which should show you something like this:
Saving trace to disk… Merged Etl: C:\Users\Sidney\Documents\etwtraces\2018-05-20_08-09-41_Sidney.etl Finished recording trace.
Now, ETW is still running and you might want to create a second capture with the performance being normal, just to have something in comparison. To do so, simply change to a normal performance situation and capture another good 20-30 seconds of it. Then hit “Save Trace Buffers” again.
Once you are done capturing traces, you can click “Cancel Tracing” to stop ETW. UIforETW should look something like this now:
Packaging up the trace
In the bottom list of UIforETW you can now see the traces that you have captured. If you want, you can right click them and rename them to something useful (eg. if you have two traces, one with good performance and one with bad, you can name them accordingly). Or you can just keep the names as it.
Last thing to do is to sent the trace to me. Right click the traces you want to send and click on “Browse Folder”, which should open an Explorer window with your trace files in it. Trace files have the extension “etl”. All that’s left to do is to zip the ETL files up and upload them somewhere so I can access them. Dropbox or OneDrive are two options that let you host and share large files like this.
And that’s it!